

ANALYSIS PIPELINE
From Financial Statements to Credit-Ready Insights
A structured workflow from uploaded financial statements to standardised figures, comparative analysis, risk assessment and credit-ready reporting.
01 · Upload
Upload financial statements and supporting schedules for the relevant reporting periods.
02 · Extract
Capture financial line items and supporting figures from available documents.
03 · Standardise
Map financial data into consistent income statement, balance sheet and cash-flow structures.
04 · Analyse
Calculate ratios, evaluate trends and compare performance across financial years.
05 · Assess
Apply relevant financial indicators, thresholds and institution-defined assessment criteria.
06 · Report
Produce financial summaries, review findings and structured outputs for credit teams.
Outputs support financial and credit review; source-document validation and final lending decisions remain with authorised personnel.
PERFORMANCE
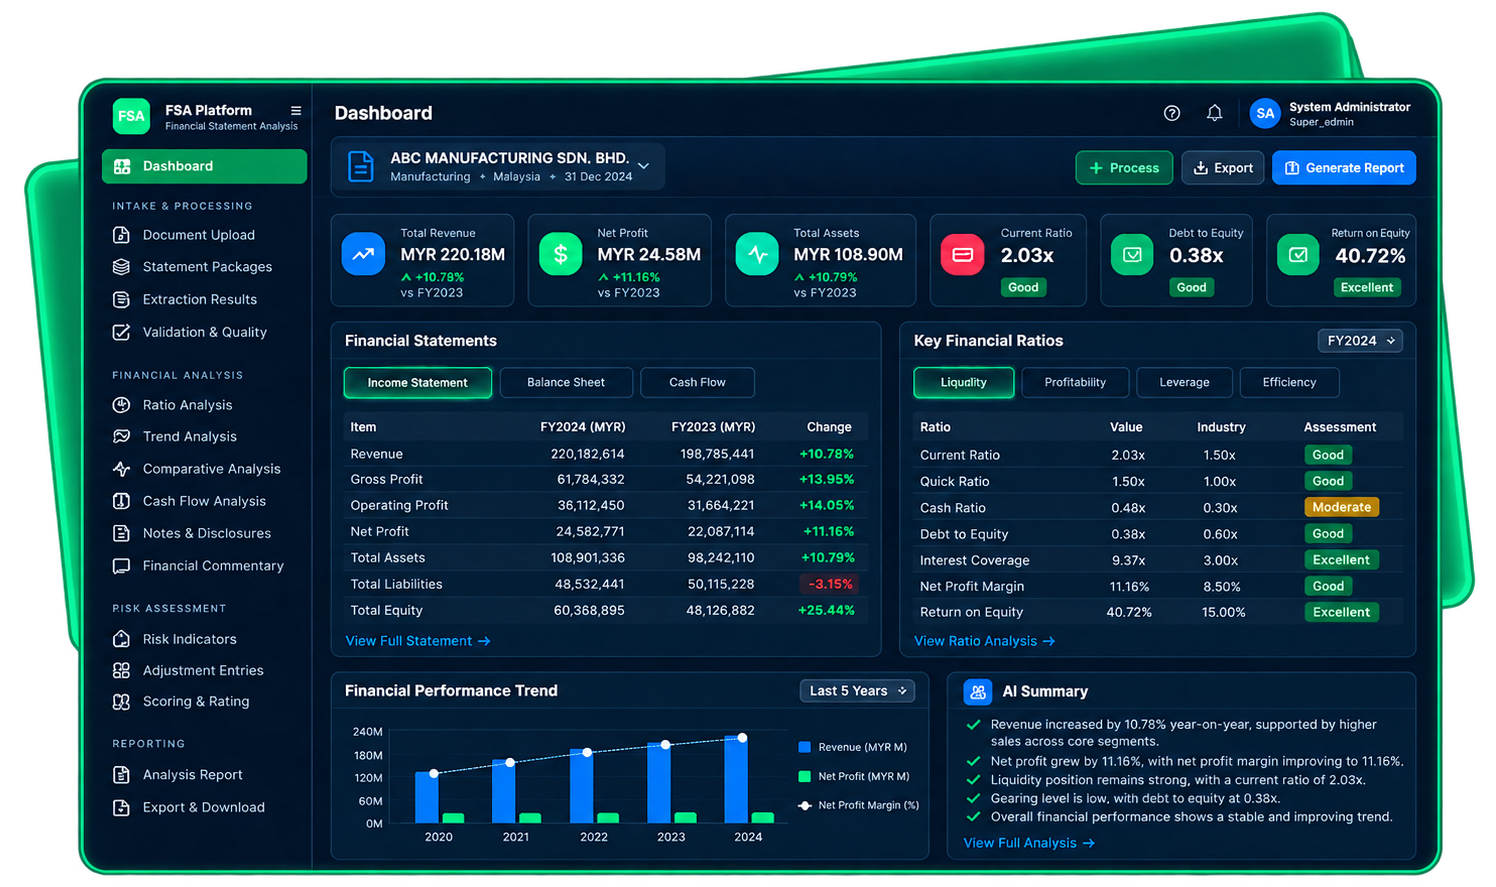
Financial Performance at a Glance
Key financial metrics, multi-year trends and ratio analysis for a clear view of financial strength.
■ Revenue ■ Net Profit · MYR, illustrative
| Financial Indicator | Value | Assessment |
|---|---|---|
| Current Ratio | 2.03× | Good |
| Quick Ratio | 1.50× | Good |
| Cash Ratio | 0.48× | Review |
| Net Profit Margin | 11.16% | Good |
| Debt to Equity | 0.38× | Good |
| Interest Coverage | 9.37× | Good |
Assessment labels depend on institution-configured benchmarks and review policies.
Illustrative financial metrics based on sample FSA dashboard data · Not an actual credit assessment
CAPABILITIES
Comprehensive Financial Statement Analysis
Bring structure, consistency and analytical depth to financial statement review, from data preparation to financial risk indicators.
Statement Upload
Upload financial statements, schedules and related documents for analysis.
Data Extraction
Extract key line items across income statements, balance sheets and cash-flow statements.
Financial Spreading
Map figures into standardised financial statement templates for consistent review.
Multi-Period Comparison
Compare financial performance across reporting periods and identify material changes.
Income Statement Analysis
Review revenue, costs, operating margins and earnings quality.
Balance Sheet Analysis
Assess assets, liabilities, equity, liquidity and capital structure.
Cash Flow Statement Analysis
Evaluate operating, investing and financing cash-flow movements.
Trend Analysis
Track growth, deterioration and changes in key financial indicators.
Liquidity Ratios
Examine short-term financial capacity through relevant liquidity measures.
Leverage Ratios
Assess debt levels, gearing and the capital structure of the business.
Profitability Ratios
Measure margins, returns and profitability across reporting periods.
Efficiency Ratios
Review asset utilisation, turnover and working-capital efficiency.
Coverage Ratios
Evaluate interest coverage and other relevant debt-servicing measures.
Working Capital Analysis
Assess current assets, current liabilities and working-capital movements.
Debt Service Capacity
Support assessment of repayment capacity using available financial data.
Financial Strength Summary
Present a consolidated view of financial position, performance and key observations.
Financial Risk Indicators
Highlight financial deterioration, unusual movements and areas requiring further review.
Configurable Thresholds
Apply institution-defined ratio thresholds and financial assessment parameters.
Reporting & API Outputs
Provide structured reports and data outputs for downstream credit workflows.
FINANCIAL INTELLIGENCE
Understand the Financial Health Behind the Numbers
Look beyond individual statement figures to assess the relationships between earnings, liquidity, leverage and cash generation.
Profitability & Earnings
Understand revenue growth, margins, earnings stability and changes in profitability.
Liquidity & Working Capital
Review short-term financial flexibility, cash conversion and working-capital pressure.
Leverage & Coverage
Assess borrowing levels, capital structure and financial capacity to service obligations.
Cash-Flow Quality
Compare reported profits with cash generated from operating activities.
Multi-Year Performance
Identify longer-term growth patterns, volatility and potential deterioration.
Financial Risk Profile
Bring financial indicators together to highlight matters requiring analyst review.
FINANCIAL RISK ASSESSMENT
Identify Financial Risks That Need Attention
Surface material changes and potential financial weaknesses with supporting figures for analysts to investigate.
Declining Profitability
Flag material reductions in margins, earnings or returns across periods.
Liquidity Pressure
Identify weak short-term liquidity and adverse working-capital trends.
Rising Leverage
Highlight increasing indebtedness, gearing or balance-sheet strain.
Cash-Flow Mismatch
Compare reported profits with operating cash flow to identify differences requiring review.
Revenue & Cost Volatility
Examine irregular revenue patterns, cost escalation and margin instability.
Financial Data Exceptions
Identify missing values, inconsistent classifications and reconciliation issues for review.
EXPLAINABLE FINANCIAL INTELLIGENCE
Every Financial Finding. Backed by Evidence.
Understand the source figures, calculations and review context behind financial indicators.
Link an indicator to its source statement line items and reporting period.
Show the numerator, denominator and formula behind each financial ratio.
Compare periods to understand the drivers behind financial changes.
Provide evidence for review without replacing professional credit judgement.
Liquidity Assessment
Illustrative finding: assess short-term liquidity using reported current assets and current liabilities.
Current Ratio = Current Assets ÷ Current Liabilities
Rounded sample values; calculation shown for illustration only.
Illustrative FSA analysis · Not an actual customer assessment
FSA + BSA
Reported Performance vs Observed Cash Behaviour
Compare reported financial statements with observed account activity to surface differences for analyst review.
Compare reported financial results with available bank-account activity to identify differences in timing, coverage, cash conversion and financial behaviour that may warrant further investigation. These indicators support analyst review; differences alone do not establish misstatement or fraud.
FSA + BSA comparison is a conceptual workflow; cross-data coverage depends on available statements, account scope and implemented integrations.
INSTITUTION-CONTROLLED ASSESSMENT
Your Ratios. Your Thresholds. Your Assessment Rules.
Support consistent financial review through institution-defined indicators, financial thresholds and controlled assessment workflows.
Configurable Ratios
Use relevant financial ratios and calculation definitions for the institution’s assessment approach.
Assessment Thresholds
Apply institution-defined reference ranges and exception thresholds where configured.
Financial Scoring
Support configurable financial score components and weightings where implemented.
Analyst Review
Review highlighted indicators and document the financial context behind findings.
Traceable Analysis
Retain calculation context and source references for verification and audit.
Governed Integration
Provide reviewed financial indicators to LOS, CDE or other approved downstream workflows.
PART OF THE BANK-I PLATFORM
FSA Works Alone. It Works Better Connected.
Use Financial Statement Analyzer independently or connect financial insights to other Bank-I capabilities through supported integrations.
FSA Standalone
Standardise and analyse financial statements, compare reporting periods and generate financial reports.
FSA + BSA
Compare reported financial performance with observable bank-account behaviour and review inconsistencies.
FSA + CDE
Provide financial ratios, leverage, profitability and coverage measures for institution-defined credit policies.
FSA + LOS
Bring financial spreading, ratios and analytical findings into the loan application review process.
Products may be deployed independently or integrated through supported APIs. Cross-product comparisons depend on the modules, data and interfaces implemented.
SEE FSA IN ACTION
Bring Structure to Financial Statement Review.
See how Bank-I FSA helps credit teams standardise financial statements, assess trends and ratios, and review financial findings with greater clarity.